Example of Basic Web Metrics Applied for a Blog

snapshot of google analytics dashboard | OnDigitalMarketing.com

Now that we have a good understanding what some of these basic web metrics are all about, let’s walk through a case study example of using these analytics in action.

For the purpose of this chapter, we’ll be using Google Analytics as our platform. Please note, there are a ton of great resources available for how to use Google Analytics. We will not be covering in-depth how the platform works, as that content is already well documented. However, we’ll be showing how the tools can give you invaluable insights into your online marketing efforts.

BuyMoreSunglasses.com

A quick technology review:

We have built our site on a Content Management System (CMS). Let’s say, we went with WordPress because the handy plugin ecosystem ensures we can drop in the analytics tracking code on every page. This ensures are current and future pages will be tracked. Or put another way, there is a phone booth on every corner for placing and recording calls. 

Background:

The OnDigitalMarketing.com website was built as a quick brochure site to serve as a repository for content taught for classes at Montana State University. It has had very little care and feeding to date, which is why it makes a good example for our purposes. Most digital properties tend to fall under this approach. Site was designed, launched, and then ignored.

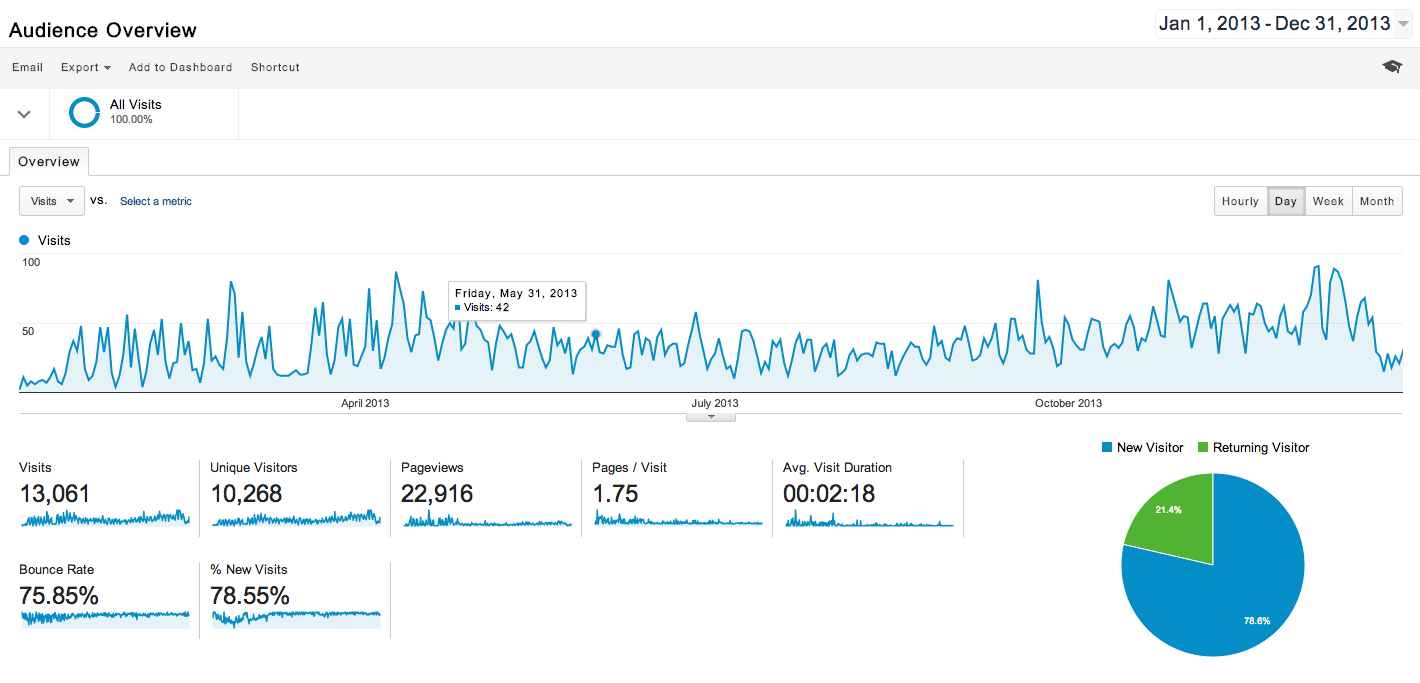
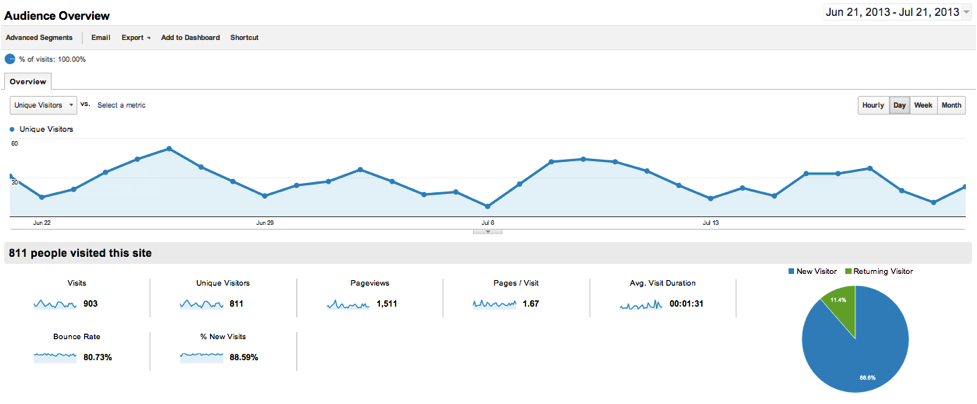
We log into our dashboard and see the snapshot posted above.

Let’s Break This Down Step by Step

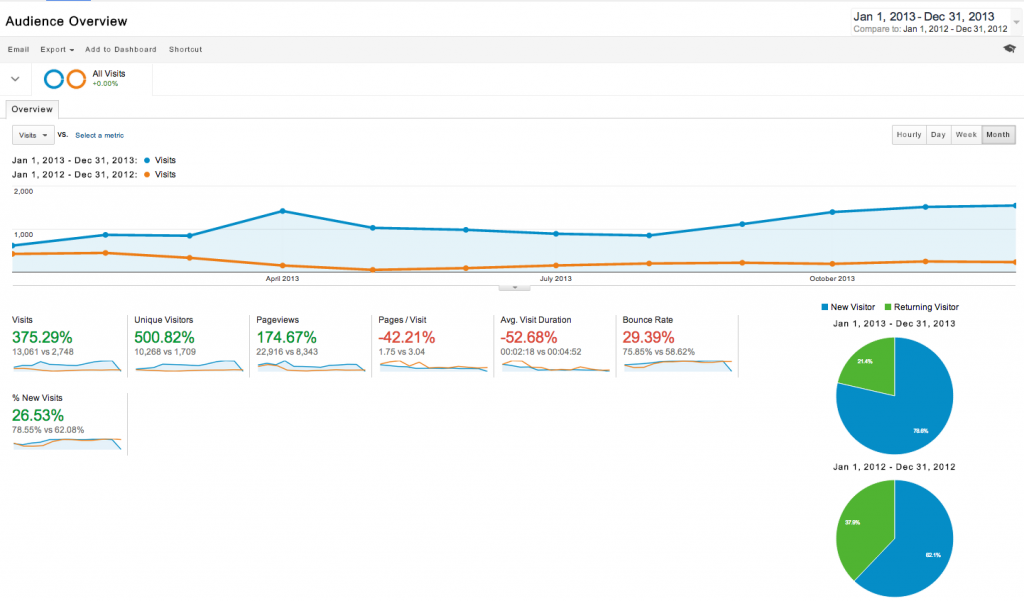
First up, we see that the default time period is for the last 30 days when we log into Google Analytics. Let’s change this to compare year over year for the past years for OnDigitalMarketing.com. This can easily be changed and as you have more data on your web property you want to look at monthly or yearly blocks of time. By analyzing year over year for an extended period it’s possible to better understand traffic trends from a big picture view.

year over year google analytics example | OnDigitalMarketing.com

Next, we start to see where our true work lies. While we have 10K Unique Visitors (500% jump from previous year) that spent an average of 2:18 on the site (down almost 50% compared to previous year). However, our Bounce Rate is at a whopping 75%. The Pages per Visit shows 1.75, so this starts to suggest that most of our traffic is reading just one page and leaving – which is very typical for a blog style website like OnDigitalMarketing.com.

Note: If the visit duration were less than 15 seconds, it would suggest that the user is finding absolutely no value on that page. This is somewhat good news.

So, users are finding value on one page (most likely) but they are not digging into other content on the site. This is bad news.

On a bright note, the new visitors make up almost 89% of the traffic. However, the trendline icon to the left shows this being pretty consistent over the last month, so we are not really growing – at least in the last month – again, a reason why we would want to look at month over month for a last year or so.

What we know about site performance from this very quick snapshot:

  1. The site pulls in fresh visitors. (75% of traffic is New Visitors)
  2. They read about a page or so. (Average Pages/Visit is 1.75)
  3. We fail to get them to look at different parts of the site. (Bounce Rate is consistently 75%)

Now, we have a better idea of what the problems are. Not unlike a patient who shows up at the hospital with a high fever and weird skin color, we have to start running more tests to better understand where the problems lie with our web property.

Key Takeaway: The above example shows what has happened on our digital property. However, it does nothing to explain why it happened. Why is our Bounce Rate so ridiculously high? How come 9 out of 10 users are new? Why do they only find one page valuable? Finally, implicit in all of this is the time frame of yearly data sets. We are discovering clues but no real culprits.

Measuring Basic Online Engagement

Screen Shot 2014-04-08 at 12.09.59 PM

Image source: Flickr 

We touched on Engagement at the start of the chapter but let’s dig deeper for further clarity.  Engagement is often confused with a term called “vanity metrics” – a measurement that sounds impressive but does not provide any real value to evaluating the success of an online marketing initiative.

For example, a marketing team might boast they have 30,000+ Users per month to their site. As burgeoning digital marketers, we might question this a bit:

  • Are these New Users (first-time visitors to the site) or Returning Users?
  • What is the Bounce Rate?
  • Most importantly, what is the Conversion Rate based on the referring traffic source as it relates to the KPI’s? In other words, how many of these Users are actually engaging with us by taking actions according to the Goals we’ve set up.

All of these questions point to how, with just a few simple tools, we can start to track User Engagement with our web property. However, keep in mind that web analytics measures what happened but utterly fails to capture why it happened.

For example, we might see tremendous amounts of time spent on the site and call this “good engagement”. But upon reflection, is this because Users are interested in our brilliant content or because they can’t find the information they’re looking for?

This is when we need to overlay Qualitative measurement methods (user experience studies and interviews) – but more on that in a second.

Measuring Engagement – A Case Study

Let’s walk through a quick example around measuring Engagement.

Let’s say we are building an ecommerce website to target new parents looking for baby products. In the brutal paid advertising world this can be a big challenge. We might look at ways to win at the original content game and pull traffic in through organic search.

Next, through an empathy exercise, such as user interviews and observations, we discover that many new mothers are incredibly nervous about when to feed newborns. We craft some helpful articles with tips around things like ideal infant feeding times.

Using our analytical skills, we see that our content targeting the keyword phrase “tips on infant feeding times” starts to perform very well for New Users. The traffic has a low Bounce Rate and a high Conversion Rate, which in this case, would be purchasing an actual product on the site. The content also shows decent shares on social media outlets like Facebook, Twitter and Pinterest (which is particularly powerful for this audience). Over time, we build our weekly email newsletter on top of this type of content and discover that it has a high open-rate and drives Returning Users back to our website.

All these signals point to the fact that we have good Engagement online.

The above example illustrates an important part of defining Engagement: it comes in ranges and can be defined across a variety of metrics to produce a blended snapshot. On one end we will have Users that show up and never come back. Unfortunately that will likely be a good chunk of your Users as you dial in your content, site experience and search strategy.

On the other end, we’ll have Users show up, Like us on Facebook, Follow us on Pinterest, opt-in to our email campaign and purchase products. Given the vast opportunity for ways to spend time online, we’ll have far more people with minimal Engagement versus the ‘super fans’ just described.

But take heart, we can always work on our Nurturing efforts to raise the level of Engagement.

What is a Website Conversion Rate?

Screen Shot 2014-04-03 at 10.22.29 AM

Image Source: Flickr kkirugi

This is where we start to see the rubber meet the road in digital marketing.

A quick review: If you recall, we spent some time brainstorming different Key Performance Indicators (KPIs) in our Strategy phase. These goals were flowed through our Execution exercises and into the actual interface design where we specifically called out conversions on the wireframes. These conversion goals could be email newsletter opt-ins or in the case of ecommerce, a product purchase. The formal definition of a Conversion Rate is:

Outcomes divided by Unique Visitors (Kaushik, 55) NEED SOURCE.

There is some debate on whether you count Users or just Sessions in this calculation. Bear in mind that many people will visit your site and most likely not be in the market at that specific time for what you are selling – be it a product or an email newsletter. This goes back to our discussion around Acquisition, Nurture and Retention and the outcomes we determined are most important for the different parts of the user’s journey.

Starting with Acquisition, our goal (ie. The outcome mentioned in the definition above) might be to get a social opt-in (i.e. a Twitter Follow or Facebook Like) or perhaps an email opt-in (ie. subscription to an email newsletter). Next, we’ll work on the Nurture piece by producing great content and working to stay top of mind. Our goal might be for users to come back to the site a certain amount of times in a given period. Once we’ve established a relationship by nurturing users into ongoing engagement, we can go to work on Retention.

Note: different business models might require vastly different approaches throughout the user journey but the big takeaway here is that we can use analytics goals to track progress and monitor conversion rates accordingly. Every goal (social follow, email opt-in, purchase, etc.) should have an associated conversion rate or number of Users who complete the action.

In the case of an ecommerce site we have a host of factors to consider: the product, the price point, and the mental algebra and approval needed to make a purchase. Given these variables we might need multiple touch points with this User to convert them into a customer.  We can set up micro conversion goals to see how our efforts are working over time. For example, are users opening our emails? Are they clicking the links inside? Once they hit the landing pages, are they engaging with the content? Watching a video, downloading a checklist, or staying on the website for a given period of time can all be considered micro-conversion goals.

As you can start to imagine, tracking all these interactions online (and offline) and tying them back to conversions can get fairly messy. Do your best to define what is critical upfront to driving your business forward with online marketing . This filter will provide you with the ability to show results and better understand what needs to happen. Strive not to get overwhelmed with the “what happened” and instead focus on the “why it happened”.

What’s a “Good” Conversion Rate?

As noted throughout this section, standard benchmarks are really hard to define across web properties due to the myriad of variables. However when it comes to Conversion Rates, it tends to average out at around 1%-2% across industries for a website.

So, 98%-99% of people that visit your property are not ready to convert. Cue the Nurturing campaign efforts!

It’s a pretty humbling statistic isn’t it?

As you become more and more comfortable with the dashboard of your web analytics package, you can start to slice data by referring traffic source to see if there are any variations in the conversion rate.

For example, you might find that traffic coming from organic search results, converts at a very high level for a specific keyword phrase, which is usually the case. Or perhaps you start to see that Returning Users convert much better than New Users hinting that maybe the user needs to take some time to research and come back.

Either way, having rich historical data at your fingertips is critical to making informed decisions. If users coming from email campaigns convert at a much higher % than social media, you’ll want to invest your time in email content. Or if traffic coming from organic search results convert better than traffic from paid ads, you may want to consider investing the ad dollars into content marketing.

Setting Up Conversion Goals

Depending on your analytics package there are a couple of ways to start tracking conversion goals. First, you’ll want to start with your KPI’s and look at your Macro and Micro Conversions. We might say an email opt-in is our Macro conversion goal as it converts the user by providing their email (Acquisition) and puts them into a Nurturing (email marketing) campaign.

So, we’d want to see the user directed to a “thank you for subscribing page”. This is a unique URL that is only navigable by completing an email opt-in form (ie. entering your email address into a form field and pressing the “Subscribe” button). By reaching this URL we know for a fact that the user successfully converted by taking an action. This is what Avinash Kaushik calls an outcome but we like the term goal since Google Analytics calls these important metrics “Goals”. Another common term is “Conversion Goals”.

The video below does a nice job explaining how this all works at a high level:

Finally, think of Conversion Rates not unlike the psychology behind making a purchase. Because purchasing a car presents significant investment (and risk) compared to buying a candy bar, more time and emotion will be involved in the purchasing cycle.

The online experience is no different. Giving a Facebook Like requires a completely different level of commitment compared to purchasing an item. There is no accident Amazon invented the One-Click buy button to remove the friction around this experience and take advantage of the impulse buy.

The good news is you can improve Conversion Rates and this is one more reason to start with a user-first approach built around empathy.

This requires you, the digital marketer, to be savvy with analytics and test, test, test.

What is a Bounce Rate?

Screen Shot 2014-04-03 at 9.56.26 AMImage Source: Flickr – Chris Isherwood

This is one of the handiest and easily applied metrics in our analytics toolbelt. Simply put, it measures when a website user hits a web page and then “bounces off”. In other words, the user leaves without viewing any other pages on the website.

When a user “bounces” it means he/she doesn’t feel prompted enough to click any links on that page. Not a thing. Ouch.

Here’s Google’s technical definition:

Bounce Rate is the percentage of single-page sessions (i.e. sessions in which the person left your site from the entrance page without interacting with the page).

The surprising thing is that quite a few beautifully looking websites can have astonishingly high Bounce Rates. This can be due to a host of factors. Are you starting to see a common pattern here with analytics? We can easily see what happened but getting to the why is always more work.

Why is my Bounce Rate so high?

Here’s a few reasons your Bounce Rate could be “off the charts”:

  • The design of the site is poor. At a glance it may look acceptable but when a user tries to accomplish something he or she might find that there is way too much noise on the page. Common ailments include poor or verbose copy, issues with font type and size, weak images and inserting way too many calls to action. Remember, simplicity wins online. Look at the Google homepage – there’s a reason it’s stayed the same for so many years.
  • Sloppy site architecture. If the site was built without a clear focus of helping the user accomplish a specific goal, the site navigation quickly reveals it. Fuzzy headings tend to confuse visitors and if we ask people to stop and figure out something they tend to vanish. Like we discussed in the Strategy section, a good rule of thumb is five to seven main headings with clear clues on what that section holds. For example, a tourist site that has “Explore Our Area” is too vague. Something like “Plan a Trip” can help lower a bounce rate by making the first step of digging into the site appear easy and approachable.
  • Referring traffic sources. The Bounce Rate is one of the most effective tools for measuring traffic quality. Assuming you’ve solved the problems listed above, the next step of investigation is to slice your data against where the visitors are coming from. You might find that people coming from social media tend to bounce at a much higher rate versus visitors coming from organic search or press sites. This can be particularly handy for measuring PR efforts. Big media hits can look sexy to the “powers that be” but often times a passionate niche blogger will send much better traffic as evidenced by lower Bounce Rates.
  • Blog Traffic. This site (OnDigitalMarketing.com)  is set up primarily as a blog). As a result, the site can pull in quite a range of Long Tail traffic – mainly, users who are looking for a very specific “something”. As a result, they might Google a keyword phrase like “what is SEO?”, read the short post on the topic, and then bounce off. Many blogs combat this with a nurturing effort. Bloggers get users to come back to the site by using email marketing opt-ins (the overlay that shows up when you hit the site for the first time). This allows the blogger to reach out and interact with the user at a later date. Once the user returns to the site, he or she is recorded as a Repeat Visitor.

What’s a reasonable Bounce Rate?

This varies tremendously across industries referring traffic sources. However, a good rule of thumb is to shoot for under 50%. Some of the best sites can hover around 30%, which is doing pretty well – since seven out of ten visitors are digging into the site beyond one click.

When the bounce rate is low, it means our SEO efforts are pulling in the right kind of traffic.  No matter how users are entering our site, whether from Googling a keyword phrase, clicking a social media link or a link from another website, if our bounce rate is low we know that we are giving them what they expect to see .

Landing page bounce rates from paid advertising are another beast. (A landing page is the first page you “land on” when you click over from something like a paid search ad or a link.) These tend to have higher bounce rates that can range quite widely from 50% – 100%. Depending on metrics like Cost per Acquisition (CPA) or conversion goals, it can make sense to tolerate such a high bounce rate. However, through ongoing testing we should always try and lower this metric. We’ll talk more about methods like A/B split testing and how to fine-tune online campaigns in the Adaptation phase.

Another thing to consider is the goal of the site. If the landing page is the front end of a portal (like Google’s homepage) than a high Bounce Rate is actually what you want, otherwise you’re confusing users as they try and use the tool to accomplish their task. Google’s goal is to give users exactly what they’re searching for as quickly as possible. In this case, a high Bounce Rate would be ideal because the user has moved onto the search results that Google has served up in response to the search.

Another factor that can influence Bounce Rate is a variable like a long scrolling page design – similar to what sites like Pinterest use. Users may be clicking through and scrolling but often times they are not requesting a unique URL, which means the analytics package fails to capture this interaction. Remember, Google Analytics defines bounce rate as the percentage of single-page sessions. This means that a user could scroll through Pinterest all evening and if he/she doesn’t click another link, the visit still counts towards the Bounce Rate.  There are some workarounds for this but might take a bit of developer help to drop in some custom triggers in the code using JavaScript.

Understanding Basic Analytics and Metrics

The first step in this journey of understanding basic analytics is to get a sense for important metrics and what they mean. There are numerous methods to apply and terms to know, with tremendous variation based around the business model and the digital property. We’re big fans of real-world examples so let’s take a peek of a website’s analytics from a fictitious company called BuyMoreSunglasses.

Before we dive in, we want to note that Google Analytics changes metric names and functionality fairly often. We do our best to update this text when these changes occur but if something seems unusual, it could be due to a change within GA itself.

BuyMoreSunglasses: Analytics Case Study

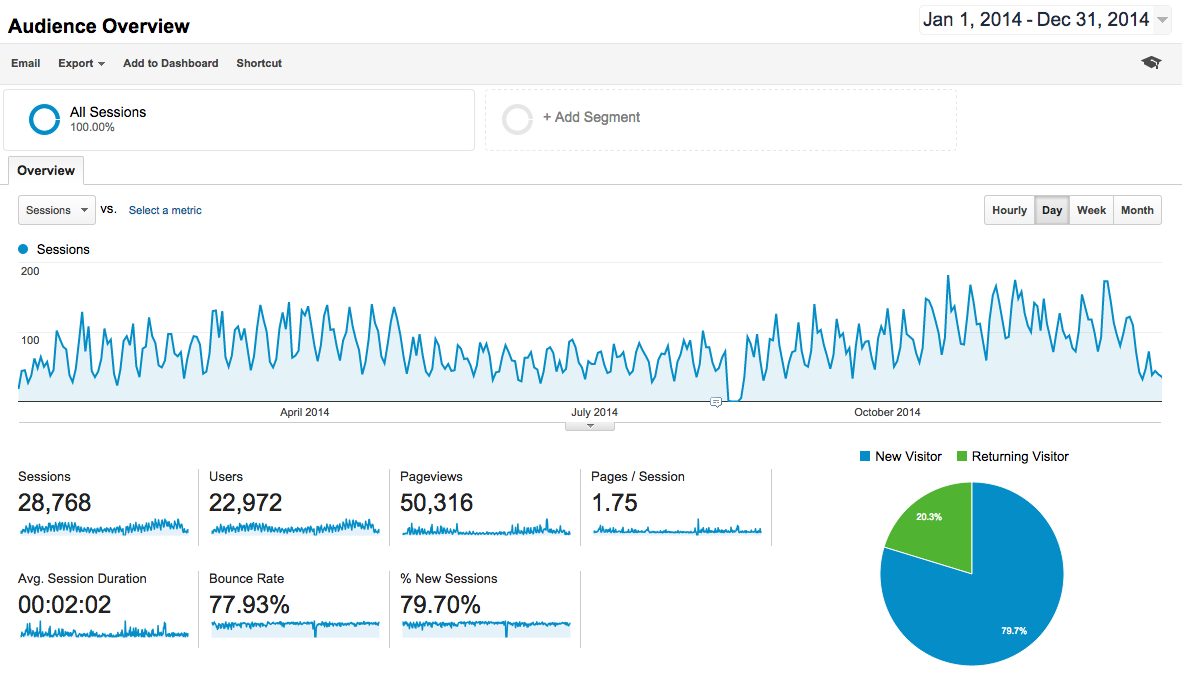
Note: The screenshot above is from an anonymous website showing a Google Analytics dashboard.

Let’s pretend that the dashboard above belongs to a fictitious website called BuyMoreSunglasses.com. We can see there are plenty of opportunities to improve the site’s performance and we’ll step through each of these metrics in the following sections. Keep in mind, that these metrics are from Google Analytics, which is the most popular analytics platform. The names for each of these metrics and their general application do not necessarily apply to other common softwares available.

For the beginner, we will start with a basic overview that focuses on six simple metrics that major web analytics platforms track. (We will explain these based on our phone booth analogy from the previous section on Web Page Analytics Explained.)

Let’s dive in:

  1. Sessions
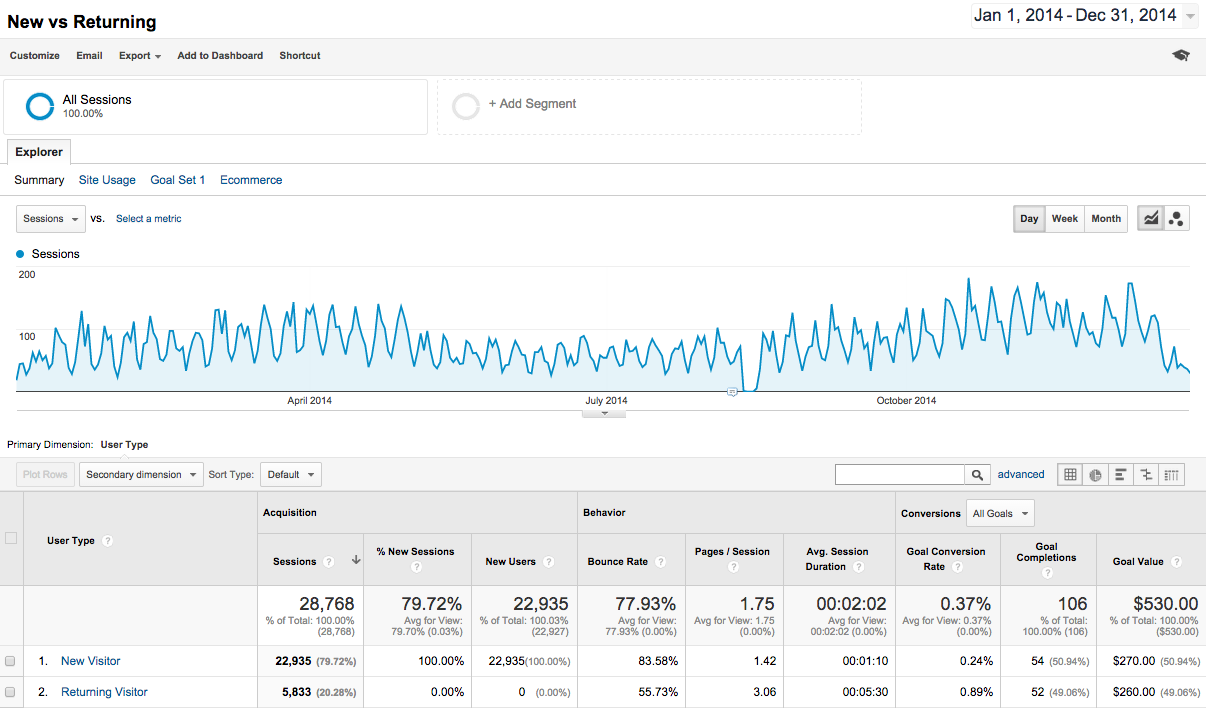
    Simply put, this tells you that someone came to your website and spent some time browsing – or (remember our phone booth analogy) they showed up in town and started making phone calls on different street corners. The tracking code also measures how long they spent on the site or put another way – how long they stayed in town. With Sessions, you can see if the population in town is growing but not necessarily what kind of people – that’s where Users comes in.
  2. Users
    This is a very powerful metric because it starts to tell you how many people came to your website rather than total sessions. It works when the JavaScript tracking tag phones home and the analytics tool then sets a unique cookie on the user’s browser. This anonymous identifier stays on the person’s browser even after they leave your site. (Hint: if a user comes back a second time, two sessions will have been recorded but only one user.)
    Here is Avinash Kaushik’s definition of Users:

    …the count of all the persistent unique cookie IDs during a given time period.

    This metric isn’t perfect. For example, if a user hits your site in the Google Chrome browser and then returns using Firefox (or any other browser) they will be recorded as two separate unique visitors. It’s pretty unlikely that mass amounts of users will switch browsers but it is worth noting that some duplication can and does occur. In the online world, “Users” is a pretty standard metric that gets thrown out for measuring engagement and assessing value of a digital property. In general, if your web property starts to bring in more than 1 million Users per month, you will be doing just fine financially.

    Note: The most important difference between Sessions and Users, is that multiple sessions can be attributed to one user but not vice-versa. In plain English, sessions are visits to the site and users are the visitors themselves. This will become important later on.

  3. New Visitor
    Ready for an easy one? New visitors are users that are visiting the site for the first time. Why the “Google gods” decided to call these new visitors rather than users, we can’t say. But we do know that this is a helpful metric as we begin to determine how many of our users are first-timers and how many are coming back for more.
  4. Returning Visitor
    In the same way you look at your phone and see multiple calls from the same person in your call history, your website can see multiple sessions and attribute them to the same user. If a user comes back to your website using the same browser, he/she is flagged as having been to the site before via a unique cookie and thus will commonly show up in the analytics tool as a Returning Visitor.  This is a helpful metric for measuring how loyal your web audience is and whether they are choosing to engage in your online efforts. (Not unlike when those loyal to you call or text on a consistent basis).For example, you might see that 30% of your monthly traffic is Returning Visitors. This could come from people clicking over to you from social media feeds, email marketing campaigns, or even repeatedly visiting the site to dig in. This starts to hint at loyalty and that your brand is building a following online.
  5. Avg. Session Duration 
    This metric is used to determine how much time our users (both new and returning visitors) are spending on our website.This is based around when a page is requested. The call is placed, the timer starts ticking, and when the user hangs up (requests another page) that start and end time is logged. Every time a page is requested it’s referred to as a “timestamp”. Remember that the only way analytics software can log this interaction is when it delivers a page back to the user. One issue with Avg. Session Duration occurs when the user is on the last page of their visit and then leaves for another site. There is no easy way for the analytics tool to measure how long this interaction takes place on the last page. It’s as if the user places a call and then the phone dangles off the hook. Since there is no formal hang-up, Google Analytics cannot measure the time on that page.

A simple case study:

Let’s look at a BuyMoreSunglasses example to illustrate the user journey and analytics behind it:

  1. Maria, a user getting ready for her vacation to Belize, googles “black sunglasses”…
  2. If we’re lucky, our site (BuyMoreSunglasses.com) pops up in the SERPS (search engine results pages) and Maria hits the homepage. When this happens, a call is placed from the street corner and the message relayed to the analytics account says, “start the timer”.
  3. Next, Maria finds “Sunglasses” in the main navigation and clicks the link. Google Analytics receives the message: “Oh, the user moved onto another page, so we will log the time spent on the homepage and continue measuring the entire session.”Now a 2nd call has been placed from a different street corner (the BuyMoreSunglasses.com/Sunglasses page) and is being measured until Maria clicks a different page. The same interaction is measured for each page, which is our Avg. Time on Page. This metric calculates how long Maria spent on the homepage before clicking to the Sunglasses page and how long she stayed on the Sunglasses page before viewing a different page.  The Avg. Time on Page can widely vary across a website. For example, a long, educational blog post might have an Avg. Time on Page of 3 minutes and 30 seconds while a homepage might have an Avg. Time on Page of 1 minute and 15 seconds.
  4. Maria decides she wants to look at other options – she types “Amazon.com” into the browser and she’s gone. The analytics has no idea for how long she spent on the last page – in effect, the call was placed but the phone never got hung up. (If Maria just left the browser open on that page, almost all analytics packages would “time out” after 29 minutes, not unlike the annoying beeping sound that land lines give after a set amount of time with no one on the line.)
  5. To recap: We know what pages the user visited based on the calls from different street corners. However, we do not know how long they spent on that last page and as a result, how long the visitor session truly was.We realize that Avg. Time on Page and Avg. Session Duration are still helpful metrics but it’s key that we look at our KPI’s. If we see a low Avg. Session Duration (maybe less than a minute), we probably aren’t convincing our users to convert. In this case, if Maria only spends 20 seconds on the Sunglasses page, we’ve failed to convince her to buy, which is an indicator that she’s not seeing what she wants. If we see certain pages with ridiculously low Avg. Time on Page and we are looking to convert a user (opt-in for an email, request information, purchase a product) then we know we have some work to do.

What’s a “Good” Avg. Session Duration?

This can be depressing. We all tend to overestimate how great our own work is – the actual numbers can be sobering. Avg. Session Duration varies widely based on:

  • Industry (and type of website)
  • Source or where the visitor is coming from (social media referrals tend to be very low as people quickly bounce back to Facebook or Twitter)
  • Device (mobile users tend to spend less time on site.)
  • Visual variables like page design and copy.
  • Finally, if a site is not designed with a focus on a user flow scenario or even a simple call to action on the footer of each page to gently nudge the visitor along, the Avg. Session Duration can be quite low.

Around two to five minutes is a common range across all referring traffic sources.

Web Page Analytics Explained

Now that we have a healthy appreciation for the difference between what happened on our digital property and the ongoing challenge of understanding why it happened, we can start to dig into the basics of analytics.

Remember, the data will tell you what the user did but it’s up to you to take that information and figure out what to do.

To track a clickstream or any user behavior on a website, every web page needs to have a small snippet of tracking code attached. This is usually a JavaScript tag that is embedded into the HTML code. Think of it as installing a pay phone on a corner in a city (admittedly, this is a dated technology but bear with me as we explore this analogy).

Analytics: The Pay Phone on Every Corner

Every web page across your site is like a street corner and you can think of analytics as a pay phone.

When a page is loaded, the tracking code tag then basically “phones home” to the analytics software on a 3rd party site and says, for example, “Hey, the About page was requested so start the timer for how long the user is on that page”. When the user then clicks over to the Contact page, the phone on that corner gets hung up and a new phone call on a different corner is placed for that fresh page. The analytics platform (eg. Google Analytics) remembers the previous phone call and files it away all the while measuring the location on the site and the time spent, in addition to many other metrics.

On a Content Management System (CMS) like WordPress, inserting this tracking tag is very easily done with a plugin. This handy feature simply spits out the tracking tag out on every single street corner across your site – i.e. page or blog post.

Don’t worry too much about the mechanics of how this happens but understand that for a web page or app to be tracked, there has to be a little marker in the code on every unique page that “phones home” and let’s a 3rd party vendor like Google Analytics or Webtrends know what’s happening.

In short, every street corner needs a pay phone to let us know where and for how long a phone call was placed on the site. Web page analytics explained this way doesn’t seem too scary, right?

If you log in to your analytics program and see zero visitors despite knowing there is traffic flowing in, you might be missing the tracking code on that page.  If this is the case, we highly recommend you get in touch with a developer (someone with a working knowledge of HTML, CSS, and JavaScript) to help you insert the tracking code on each page.

Tip: There is a quick way to verify if the tracking code is indeed installed correctly on an individual web page. Almost every browser has a feature where you can view the source code (In Chrome: View -> Developer -> View Source). This will show you the HTML for that page and you can simply and do a “Find” for the tracking code (In Chrome: Edit -> Find). See below for what to look for within universal analytics – UA. Chrome (Edit the following page). Hannah

What to Look For

For Google Analytics this tracking identifier usually starts with “UA-“ and can be a quick check to make sure everything is installed correctly.

It should look something like this:

<script type=”text/javascript”>

var _gaq = _gaq || [];
_gaq.push();
_gaq.push();

(function() {
var ga = document.createElement(‘script’); ga.type = ‘text/javascript’; ga.async = true;
ga.src = (‘https:’ == document.location.protocol ? ‘https://ssl’ : ‘http://www’) + ‘.google-analytics.com/ga.js’;
var s = document.getElementsByTagName(‘script’); s.parentNode.insertBefore(ga, s);
})();

</script>

Where the UA – XXXXX-X will be a unique set of characters for your particular web property. Think of it like a phone number for your website that only Google Analytics can see. Every time a call is registered from your site (remember, this means a user is there) to Google Analytics, the software is able to track data about what that user is doing on that particular page.