5 Factors That Influence Technology Adoption Rates

iPod and technology adoption curves

Image source: http://www.admadness.co/

You may be asking yourself, “This research around adoption curves is all fine and interesting but how does it apply to digital marketing?”

Great question. Let’s walk through it with a real-world example from Apple.

Apple’s Brand Ecosystem

Rogers outlined five characteristics that influence a person’s decision to adopt or reject an innovation.

Here’s how Apple plays off this brilliantly (From Diffusion of Innovations).

  1. Relative Advantage – How improved an innovation is over the previous generation.
    For example, is the new iPad that much better than the previous? Over a laptop? Over a Microsoft or Amazon product?
  2. Compatibility – The level of compatibility that an innovation has to be assimilated into an individual’s life.
    In short, how hard is it to integrate this into my daily life? An iPod is very easy to integrate as Steve Jobs famously said when introducing it to the world, “A thousand songs in your pocket.”
  3. Complexity – If the innovation is too difficult to use an individual will not likely adopt it.
    Consider touchscreen interfaces vs. multiple menus: We’re in a hurry. We’re lazy. We don’t want to think. Tap a button and experience an app – an iPhone is so intuitive toddlers can quickly use them.
  4. Trialability – How easily an innovation may be experimented with as it is being adopted. If a user has a hard time using and trying an innovation this individual will be less likely to adopt it.
    Is there a sandbox to try it out in first? Think of the Apple retail store experience which is specifically designed to get users interacting with all the devices in a casual way.
  5. Observability – The extent that an innovation is visible to others. An innovation that is more visible will drive communication among that person’s peers and personal networks and will in turn create more positive or negative reactions.
    Consider the ubiquitous white headphones that drove the original print campaign for Apple and showed off to the world how that person was listening to an iPod.

Twitter’s Adoption vs. Awareness paradox

So, we see how Apple has brilliantly dealt with these 5 barriers to adoption.
Another historic case to consider is the history of the adoption of Twitter versus the awareness of the platform.
In 2011, most Americans had heard of Twitter but according to Pew Internet Research Foundation only 11% have adopted the platform in that year.

Note: Awareness and adoption are two distinct metrics and it’s important as a digital marketer not to confuse the two.

While awareness is important, it is adoption of a solution that drives an economic engine as it can be monetized. People can know about an iPod but it’s the act of them adopting the device into their lives by buying the product and content on iTunes that makes Apple so profitable.

It’s also worth noting that adoption can mean many things in digital – subscribing to an email newsletter, liking a brand on Facebook, following on Twitter/Instagram, or grabbing an RSS feed. It’s more commonly referred to as “engagement” and we’ll cover the nuances of this later in the Strategy and Measurement sections.

If we look at the research, we see that Twitter had some serious challenges for adoption.A staggering 92% of Americans were aware of the platform, so it obviously no longer had to worry about getting the word out about the brand.Interestingly, an almost complete saturation of the US market for brand awareness puts it in the enviable ranks of household names like Nike or Coca Cola in 2011.

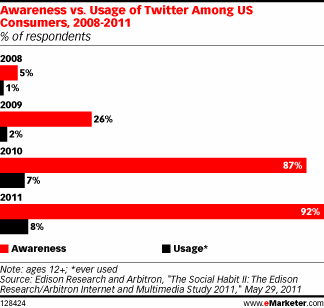
Twitters' challenge on adoption versus awareness research
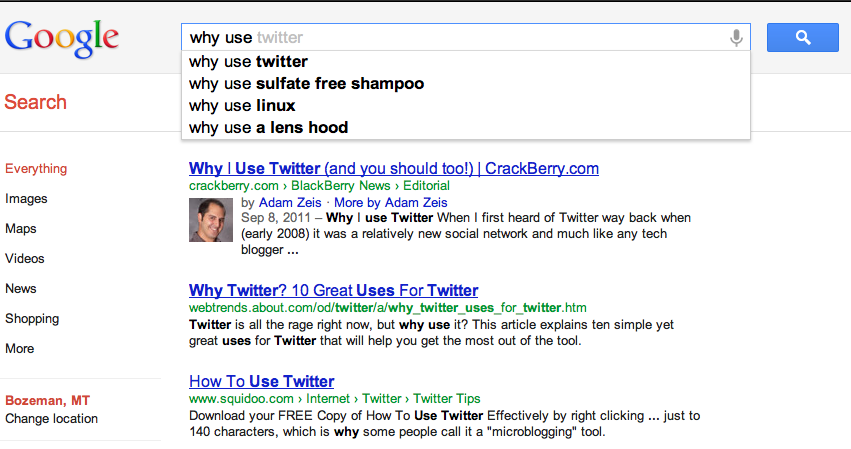
Consider the auto-complete on Google at this time (auto-complete is based on the most common queries for particular search terms). When users typed in the phrase “Why use” – the first suggested result is “Why Use Twitter” .
autocomplete for why use Twitter
This quick experiment indicated that many people were still trying to figure out why to use Twitter. The advantages to the uninitiated are not immediately present, unlike an iPod where a potential user could quickly see a benefit (“A thousand songs in your pocket”).
Add to this things like Rogers’ factors of Complexity and Trialability and you start to see why Twitter struggles with adding new users.
New people to the platform are confused and intimidated by the cryptic “@ reply” or how to send a direct message.
However, once they interact and start to see value by following people and brands whose interest align with theirs, they become rabid consumers of the content posted even if they never put out a Tweet themselves.

The 5 Customer Segments of Technology Adoption

Back to Rogers’ research, we see that not everyone will immediately adopt a disruptive idea despite obvious benefits. Over years of research, Rogers identified some fascinating personality traits that help us organize how people will accept a new innovation. It turns out we approach innovations in the following ways.
(From Diffusion of Innovations)
Innovators (2.5%) – Innovators are the first individuals to adopt an innovation. Innovators are willing to take risks, youngest in age, have the highest social class, have great financial lucidity, very social and have closest contact to scientific sources and interaction with other innovators. Risk tolerance has them adopting technologies which may ultimately fail. Financial resources help absorb these failures. (Rogers 1962 5th ed, p. 282)

Early Adopters (13.5%) – This is the second fastest category of individuals who adopt an innovation. These individuals have the highest degree of opinion leadership among the other adopter categories. Early adopters are typically younger in age, have a higher social status, have more financial lucidity, advanced education, and are more socially forward than late adopters. More discrete in adoption choices than innovators. Realize judicious choice of adoption will help them maintain central communication position (Rogers 1962 5th ed, p. 283).

Early Majority (34%) – Individuals in this category adopt an innovation after a varying degree of time. This time of adoption is significantly longer than the innovators and early adopters. Early Majority tend to be slower in the adoption process, have above average social status, contact with early adopters, and seldom hold positions of opinion leadership in a system (Rogers 1962 5th ed, p. 283)

Late Majority (34%) – Individuals in this category will adopt an innovation after the average member of the society. These individuals approach an innovation with a high degree of skepticism and after the majority of society has adopted the innovation. Late Majority are typically skeptical about an innovation, have below average social status, very little financial lucidity, in contact with others in late majority and early majority, very little opinion leadership.

Laggards (16%) – Individuals in this category are the last to adopt an innovation. Unlike some of the previous categories, individuals in this category show little to no opinion leadership. These individuals typically have an aversion to change-agents and tend to be advanced in age. Laggards typically tend to be focused on “traditions”, likely to have lowest social status, lowest financial fluidity, be oldest of all other adopters, in contact with only family and close friends, very little to no opinion leadership.

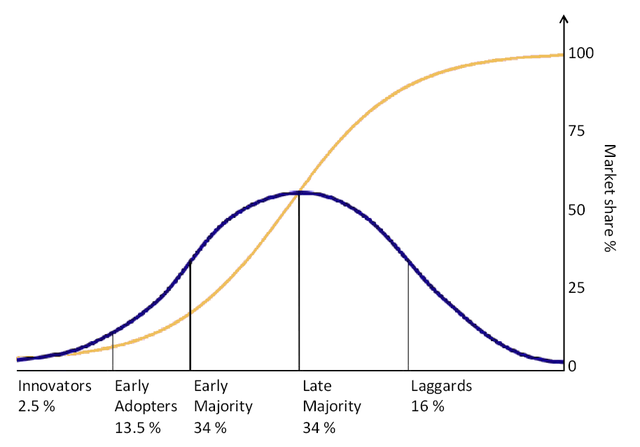
If we were to graph these groups, we’d see the standard bell shape curve:

How technology gets adopted. Everett Rogers Diffusion of Innovation

Where blue represents the groups of consumer adopting a new technology and yellow is the market share which obviously reaches 100% following complete adoption. This is the point of market saturation.

Which One Are You?

It is important to note that individuals do not always line up as “Innovators” in all areas of their decision making processes. For example, a person may adopt cutting-edge green technologies for their home with solar heating and yet not belong to an online social network or own a smartphone. We bounce back and forth across the curve in large part based on the pain points we are trying to solve and our interest in the underpinnings of the change presented.

Bonus: While this research can seem a bit high-level, it has profound real-world impacts on how technology products and services get adopted. Many entrepreneurs and marketers fail to take into account that you must move from left to right in the adoption curve. As a result, they drastically overestimate their market size and how much work and time will go into getting a disruptive idea into the mainstream. For a detailed must-read in this area that builds on Rogers’ research with real-world examples from the tech space, check out Crossing the Chasm by Geoffrey Moore.

Diffusion of Innovation

Painting of A Mountain

The man credited with understanding how people adopt new ideas came from humble beginnings on a farm in Caroll, Iowa. In 1936 a hot dry summer produced a drought that wrecked Iowa’s corn crop. Yet, some farmers had started using a new hybrid seed corn. This new seed not only produced 25% more yield but was also drought resistant. As he watched his father’s crops struggle during that steamy summer, Everett Rogers became intrigued on why their family farm had not adopted the new seed corn.

This simple and obvious question led Dr. Rogers to uncover some of the most interesting quirks about human beings and their relationship to innovation based on a blend of their personal values, economic status, social standing, and education.

His study of how a radically different idea gets adopted was put out in a landmark study in 1962 in the book, Diffusion of Innovations. Through multiple editions, the book went on to look at over 508 different diffusion studies for nearly 40 years. In particular, Rogers was fascinated by why some people will eagerly adopt a new idea and others baulk despite convincing evidence that it is to their benefit to do so, much like he had witnessed as a boy on his father’s corn farm in Iowa during the Depression.

What he found out was that this phenomenon of resisting adopting new ideas was not confined just to the Midwest. It was rampant in public health education efforts in South America, as evidenced by Amazon villagers not adopting the practice of sanitizing their water by boiling based on cultural taboos.

Synthesizing all these studies over time and cultures, he helped identify a five-step adoption process that holds consistent across vastly different groups. Individuals move through various distinct stages before they will take up a disruptive idea or practice.

From Rogers’ Diffusion of Innovations
The five stages of the adoption process are and the ways it relates to digital marketing today include

  1. Knowledge: In this stage the individual is first exposed to an innovation but lacks information about the innovation. During this stage of the process the individual has not been inspired to find more information about the innovation.
    Hint: How can social media drive curiosity?
  2. Persuasion: In this stage the individual is interested in the innovation and actively seeks information/detail about the innovation.
    Hint: How can smart website content on the Google search results page help educate this potential user?
  3. Decision: In this stage the individual takes the concept of the change and weighs the advantages/disadvantages of using the innovation and decides whether to adopt or reject the innovation. Due to the individualistic nature of this stage Rogers notes that it is the most difficult stage to acquire empirical evidence (Rogers 1964, p. 83).
    Hint: How can you make the first digital experiences with the brand enjoyable and useful?
  4. Implementation: In this stage the individual employs the innovation to a varying degree depending on the situation. During this stage the individual determines the usefulness of the innovation and may search for further information about it.
    Hint: How can you build an online community to help new users get up to speed on using your product or service? Can you craft content such as a “Beginner’s Guide with FAQ’s”?
  5. Confirmation: Although the name of this stage may be misleading, in this stage the individual finalizes his/her decision to continue using the innovation and may use the innovation to its fullest potential or abandon it altogether.
    Hint: How can you reassure a user in real-time they made the right decision?

Zero Moment of Truth

As a digital marketer, you have the unique first-time opportunity to touch a consumer across all five steps of this process. Research from Google suggest that customers constantly refer to the search engine throughout their entire buying process and collect sources to help them in their purchase decision. This trend is on the rise with people using 10.4 sources almost double what the used in 2010 (5.4 respectively).

Thought Experiment: For each of the 5 parts of the process, how might you as a marketer shape the consumer’s decision for purchasing a radically new electric tea kettle? Brainstorm specific ideas around messaging, content, user experience based on the video above.

Unifying Laws of Online World

Tying Metcalfe and Moore’s Law Together

Let’s take a brief second to understand how these two laws overlap in a real-world example to better understand the implications for the case of traditional print media. We now know that both Metcalfe’s and Moore’s Laws are exponential in nature which, to drastically simplify, means they increase very quickly in a short amount of time.

Craig’s List

In 1995, Craig Newmark began sending emails to a list to friends featuring events in the Bay Area. By 1996, he had moved to make the emails a web-based service. At that time, server space was very expensive to rent so the site was initially limited in the cities it would support. As word of mouth grew, more people started using the website and the demand for the service took off.

Here is where Metcalfe’s Law comes into play – the more people that join the network, the network becomes exponentially more valuable. If nobody used Craig’s List, it would have quickly died off and been buried in the graveyard of web properties following the dot com bust in the early 2000s. But the site was incredibly useful (albeit ugly) and people flocked to it in droves. 

So for a digital property to grow very fast, it has to have the ability to do what technologists call “scale”. Scaling means the technology or company can handle massive growth in a short amount of time. For websites it often refers to the ability of a digital property to handle traffic where more and more users are accessing and uploading content. (You may remember the scene from the movie The Social Network where Mark Zuckerberg screams at his partner, “Facebook doesn’t crash!”).

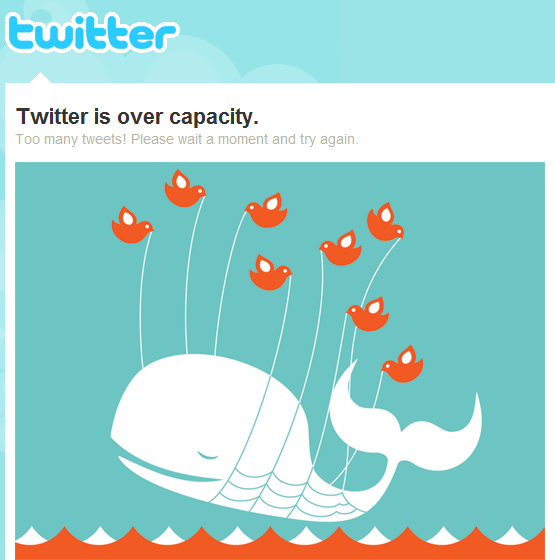
When sites’ crash they come under tremendous loads of traffic and in short it zaps the servers ability to serve up content. Twitter for example has had numerous problems in this area when major news events break and has resulted in its infamous “Fail Whale” being shown on the site.

Twitter has had problems scaling to handle users tweets

Moore’s Law to the Rescue

What Moore’s Law does is step up and help companies afford to scale. As we covered, consumers get better technology for less cost since the infrastructure doubles every two years. In the example of Craig’s List, we see that the cost to host and serve up content falls very quickly. Which means that new users can continue to join the network in greater and greater numbers.

The cost to the entity offering the service does not necessarily increase in direct relation to the number of users joining. If your marketing a web service or company these are good problems to have.

So, these two laws are critical to intelligently discussing digital marketing.

The pace of change will not slow down. Instead, it will get faster thanks to Moore’s Law. It will lead to more and more smarter devices connected to the web. Whether your digital property grows exponentially or not will owe a huge debt to Metcalfe’s Law. If nobody was posting on Craig’s List there would be no value in going on the website (i.e. network).

What caught traditional print newspapers flat footed was how quickly people pulled away from posting classified ads in their daily paper. It was just faster, easier, and cheaper to sell stuff on Craig’s List. In addition, you can post a picture in color – all for free. This shift completely caught the newspaper industry off guard and a legacy revenue stream that had been constant for decades dried up almost overnight. The ease of use and usefulness of Craig’s List makes it an irresistible network to join (thanks to Metcalfe’s Law) as it provides tremendous value for linking up buyers and sellers and does this for free (thanks to Moore’s Law). Both of these value propositions are directly linked back to Metcalfe and Moore.

If you’re following along what jumps out at you as the major challenge with getting traction on a digital property? You should be thinking value propositions and rest easy knowing Moore will help you scale.

The sting of the early stages of Metcalfe’s Law

As you can probably guess, getting early consumers to join and participate on a network is incredibly difficult. Do not underestimate how hard it is to earn people’s attention and provide an ongoing return on investment of that simple gift.

Fortunately, a social scientist that grew up in the Depression and started studying seed farmers provides us a good outline for combating the early sting of Metcalfe’s Law and getting it to work in our favor.

Moore's Law Explained

Moore’s Law and Growth of Technology

Speaking of Facebook, the ability for the platform to scale to handle unbelievably massive amounts of data owes a debt to Moore’s Law. With 800 million people around the world uploading text, images, videos for free, the amount of server space required becomes mind-boggling.

But how does the technology infrastructure keep pace with a Facebook’s growth? Or to expand out, why does the digital space change so fast?

In 1965, the co-founder of Intel, Gordon Moore wrote a paper that stated the number of components in integrated circuits had doubled every year from the invention of the integrated circuit. Later Moore revised his law to say that the number of transistors on a chip would double every two years, which has held pretty much true. (Although some argue it has become a self-fulfilling prophecy for the semiconductor industry.)

This somewhat obscure law has governed much of technology’s growth in the 20th and 21st centuries and ruled Silicon Valley. It means computers get smaller, faster, and yet hold more data.

Consumers get two remarkable benefits: their technology gets faster and it costs less money.

This short video from Scientific American does a nice job:

What Moore’s Law Means

Moore’s Law in effect means that power doubles and costs are cut in half every two years. It’s why we can fit thousands of songs in our pocket. Or have real-time navigation in our cars through GPS. Or stream videos on our televisions and laptops.

Most importantly, it means that technology innovation will not slow down but instead continue to speed up.

Once you start to grasp the implications of Moore’s Law you quickly see that the coming years will continue to bring unprecedented change. Technology gets better and cheaper over time – an unnatural benefit that rarely occurs in traditional economic models.

Moore’s Law builds the foundations for incredible innovation and disruption. When technology can grow at such a rate, the applications of such technology are no longer limited by infrastructure but rather by creativity. Google gives away much of its offerings for free in part by being able to exploit Moore’s Law. The company can continually store more data for cheaper and deliver it faster to its users. As a user, we have free email, powerful search engine, Google Earth, and real-time maps on our phone. All this has taken just a few years not decades to develop.

Fallout from Moore’s Law

Such incredible change and innovation does not come without casualties though.

Witness the media industry completely caught off guard with the rapid shift to online consumption. Craig’s List allows anyone to sell products or services online for free, completely replacing classified ads and crippling the newspaper industry almost overnight.

And where consumers go, so goes advertising. We’ll return to this in the Research part of the text.

Predicting Growth of a Social Network

Why Social Networks Are So Hard for Marketers

The conundrum of launching a network is how do you get early users (i.e. customers) to join when you have so few on the network? In short, every purchaser of technology in the 20th century (and for most of time) has had to ask themselves, “Is this thing really worth the hassle of signing up?”

Imagine how hard it would be to sell the first telephones when hardly anyone else can use it. It takes a special demographic to be an initial buyer of such a disruptive technology. But as more and more people buy a telephone (and thus join the network) it becomes increasingly important for non-users to own one as well. After all, the value in joining a network is the experience of the interactions with other users that occur by being on one network.

How to Build a Network

Back to marketing the first telephones: As a marketer, you’d maybe position the product on user cases that they need a telephone to connect with loved ones. Or for emergencies. Or to do business. These special cases start to represent strong value propositions for a new user to adopt the technology.

Note: This is very important. If the network can establish brand dominance, it will over time literally force users to join if they want to interact with other users. The power of the network becomes too strong to resist adoption and literally pulls users in if they want to communicate with their social circle. (Facebook has executed brilliantly on this fact.)

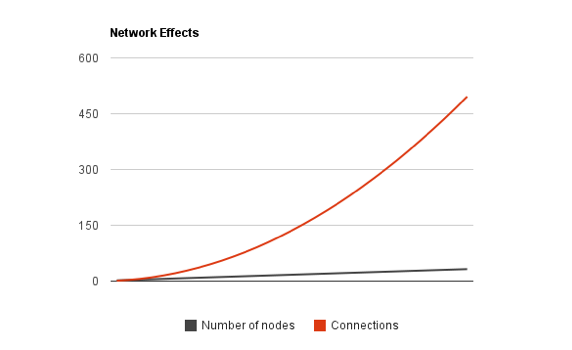
Therein lies the strong impetus for a new user to join the network and is essentially what Metcalfe’s Law is all about – that the number of unique connections in a network due to the number of nodes can be roughly expressed mathematically as n(n-1)/2.

Which means:

  • Two telephones can only make one connection: 2((2-1)/2) = 1. So the “value” is roughly one. Not much right?
  • But five telephones can make ten connections. 5((5-1)/2) = 5*2 = 10
  • And Twelve can make 66 connections. 12((12-1)/2) = 12(6.5) = 66

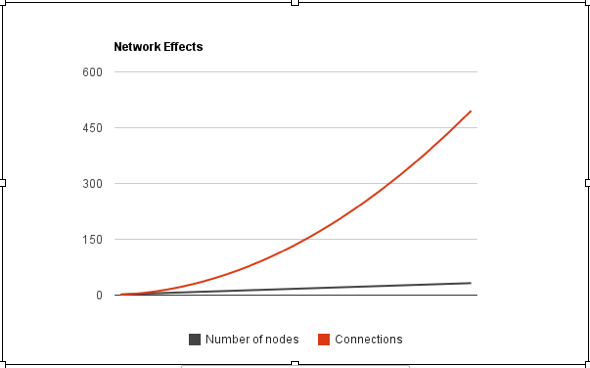
If we were to plot these numbers, we would start to see some interesting growth…

Growth analysis of a social network as shown by metcalfe's law

Notice how the number of nodes being added (telephones in this example) grows at a fairly predictable clip over time? A mathematician would call it linear growth.

But the connections representing value in red, while growing at a fairly steady rate at first, all the sudden increase very quickly over time despite the fact that the number of telephones being added is nowhere near as rapid.

Key Concept: So with just a few more nodes added, the network suddenly becomes way, way more valuable due to all the connections created exponentially thanks to Metcalfe’s Law.

This is what mathematicians call exponential growth and is at the heart of how things like Facebook can go from 0 users to 800 million in only seven years. (It’s also the classic “hockey stick” chart that every starry-eyed web entrepreneur puts into their business plans to pitch to venture capitalists.)

And this growth is incredibly difficult to achieve.

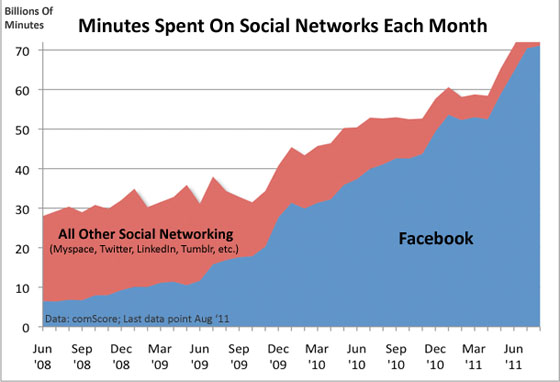
Let’s compare Facebook’s growth against the above chart example for telephones – do you see the obvious overlap of Metcalfe’s Law visually?

Here in this example, we can use minutes spent on a social network as a proxy for measuring the value of that network. We see that Facebook bumps along at a fairly linear rate from June to September in 2008. Than it starts to climb as more people join the network. In June 2009, it takes off and does not slow down in its quest to dominate our time against all other social networks.

This is Metcalfe’s Law in action.

Metcalfe's law as shown by Facebook's growth

Source: Comscore

While room for debate remains on whether Metcalfe or Reed’s Law is correct when applied to the web, the big idea to keep in mind is that networks can scale to large numbers very quickly – commonly referred to as exponential growth. The near instantaneous nature of the Internet is what helps make this exponential growth possible. We’ll come back to this later when we discuss viral marketing and why things spread across a network very quickly but now you understand how.

It is worth noting that Metcalfe’s Law is not an absolute perfect law. The “value” of the network is highly dependent on the user’s pain points but nonetheless it represents a good rule of thumb to consider when considering ramping up an online community and staying motivated when the growth does not immediately happen. If we look at the chart, we see quite a bit of time where the value and the connections barely climb at the same rate. This linear growth was true even for Facebook up until roughly June 2009.

Perhaps there is no better ironic example of network theory than that of grandparents who grew up with a young technology called the telephone and are today joining Facebook to communicate with their grand kids.

Thought Experiment:
Imagine, it’s the late 1920s.  If you were a marketer, how would you go after getting people to use a telephone? You have a couple basic tools for getting a message out, namely newspaper and radio. What would you position the benefits on? How would you get early users on the network?