How Search Engines Work

“Serving our end users is at the heart of what we do and remains our number one priority” – Founders’ Letter from Google, 2004

Eventually, computer scientists developed small programs that went out scoured the web and looked at what exists on a web page. They gave them the nickname “spiders” because they are constantly “crawling” over the web to discover new content. These spiders gobble up the information on a web page and pass it back to a massive hard drive in a process called “indexing”. When a website has been indexed, the search engine knows what content is on that page and when a user enters a keyword phrase, the search engine says, “Aha, I know a bunch of pages that have that type of content, let me serve that up for you.”

The user is then presented with a page of links that the search engine thinks most closely resembles what they are looking to find. This page is called the Search Engine Result Pages or “SERPs” and is what shows up with blue links and descriptions underneath.

Search Engine Algorithms

An algorithm is a process used by computers to solve a specific problem.  Search engines employ constantly evolving algorithms to best figure out what a user might be wanting when they type in a keyword phrase (commonly referred to as “queries”) into a search box.

The difficult challenge search engines must solve is determining the user’s intention.

Consider this seemingly simple question – if a user types in “Paris” what might they be looking for?

  • Could it be Paris, as in the city in France?
  • Or is it Paris Hilton?
    If you add up the number of infinite variations on a narrow keyword query like this, the challenge of serving up relevant results becomes mind-boggling difficult.

So, the search engines use an ever changing variety of factors to figure out what a user is really looking to see using statistical distributions. Google rose to prominence by being especially good at this through its PageRank algorithm.


History of Search Engines

As we saw with Google’s Zero Moment of Truth research, consumers are using on average of 10.4 pieces of information before they make a purchasing decision.

So, where do they turn to help gather all this information?

Search engines – and overwhelmingly Google but more on that later.

History of Search Engines

Starting in 1946, research scientists began investigating ways to store and retrieve data. These early visionaries saw a world where people could literally be anywhere and using a connection over a network be able to retrieve data.

Fast forward to the 1980’s and Switzerland:
The physicists at the European Organization for Nuclear Research (CERN) had a fundamental problem. They had massive amounts of data stored on computers but could not easily navigate and pull together all this data in an easy manner.

In 1980, Tim Berners-Lee, an independent contractor at the European Organization for Nuclear Research (CERN), Switzerland, built ENQUIRE, as a personal database of people and software models, but also as a way to play with hypertext; each new page of information in ENQUIRE had to be linked to an existing page.

With the simple idea of “linking” pages together using some new software code protocols, Berners-Lee set about solving that problem. As with most cutting-edge ideas, he received little interest at the time. However, he always able to get approval to work on the project in 1989 and set about coming up with a name, eventually settling on World Wide Web. This became the underpinnings for the famous “www” that precludes many URL’s.

The big breakthrough though came in 1993 when the first Internet browser was invented called Mosaic with its roots at the University of Illinois, Champaign-Urbana. This went on to become known as Netscape and provided a graphical interface for navigating the web.

However, the fundamental problem that particle physicists at CERN wrestled with still existed, which was how do you sift through millions of web pages to find what you want?

This subtle problem is at the heart of how search engines work and one in which the major players are still trying to find ever elegant solutions.

Let’s take a peek at how search engines work next.

Social Media Engagement

Researching Social Media Engagement

Thinking back to the original questions in this Research section – how we do know what are ideal user’s habits are when it comes to social technologies?

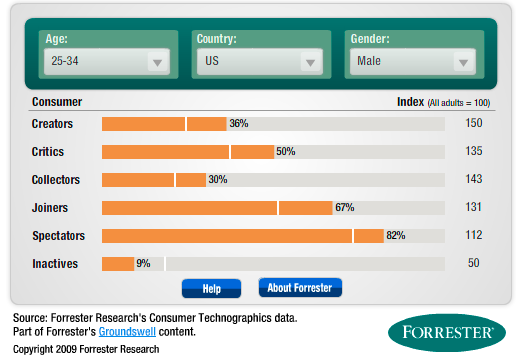
Fortunately, Forrester has developed a simple online tool (for free!) that let’s us tap their research data by filtering on a basic demographic level for some insights into the makeup of our audience.

Let’s return to our user persona of Chris Sankowski, who is the avid Moleskine user we’re seeking to attract to our add-on product. We know he is a male, 28, and living in the U.S. Ideally, we could plug in all the other demographic and psychographic data but this gives us a good starting point for making some assumptions on this group’s social media habits.

So, we see the following:

  • Creators – 36%
  • Critics – 50%
  • Collectors – 30%
  • Joiners – 67%
  • Spectators – 82%
  • Inactives – 9%

Data for a social media user will engage

This data can be great to know but how do we put it in action? Let’s see if we can better inform our general strategy for our social media roll-out.

Creators and User Generated Content (UGC)

The data for this demographic skews higher than the general average for Creators (24% vs. 36%).

  • We know our user persona is correct for having Chris being active at publishing on a blog at least once a month.
  • This tell us that we might be able to get this group to help us with some User Generated Content (UGC) for our website in the form of photos or video of our product in use.
  • Better yet, we might even get some submissions on how our product helped them rise in their careers as a guest blog post.

Conversationalists and Twitter

While the tool does not allow for Conversationalists, chances are they would be at least 36% – most likely higher. Obviously, a Twitter presence is a good bet here.

Critics, Brand Experience and Online Reviews

The fascinating part is that Critics come in at roughly 1 in 2 (compared to 36% in the general survey). This is a highly engaged audience, so we absolutely have to be on our guard for monitoring our brand online and participating in the conversation. There will be little room for our Moleskine add-on product to fail and last long with this group. We predicted as much already in the previous chapter – good to see our user persona assumption validated.

How to Compete with Critics On Our Side

  • If we nail the design and build a strong brand experience, we make it incredibly difficult for cheap products to compete with us and last based on price (Remember, we like to win on brand and never on price).
  • With a poor product, this crowd will simply tear it apart and Google will index the results given how active they are as Creators.
  • Nielsen in 2009 found out that 70% of online users trust 3rd party reviews.
  • Brand demise will follow shortly.

So, to harness this insight, we might want to ship our product with a gentle ask that says, “If you love it, will you show it?”

  • We will show our gratitude in turn with tweeting their online reviews and posting them to our Facebook fan page but at a rate of only twice a month to avoid fatigue with puffing ourselves up.
  • Knowing they are likely to comment, our Facebook page could kick off a lively conversation if we nail the content creation piece focused around their emotional aspirations from our user persona.

Spectators and Content Strategy

Finally, we see that 8 out of 10 are Spectators (compared to 73% of general survey). This shows that the majority of current and potential users will be watching us. We have a tremendous opportunity with our content strategy to provide great value in return for their time. Blog posts, interviews, photos, and videos around helping the on the go motivated professional succeed in their career have a good chance for being consumed. We will test for engagement with our website analytics, retweets, and Facebook/Google Plus shares.

Eventually, this will be the cornerstone that builds our brand.

Key takeaway: By layering Social Technographics research on top of our user persona that already includes interviews, demographics, and psychographics, we can have confidence our social media efforts will resonate with our target market.

Social Media Users

Data on Types of Social Media User

: Forrester Global Social Technographics Update 2011

Research on Social Media Users

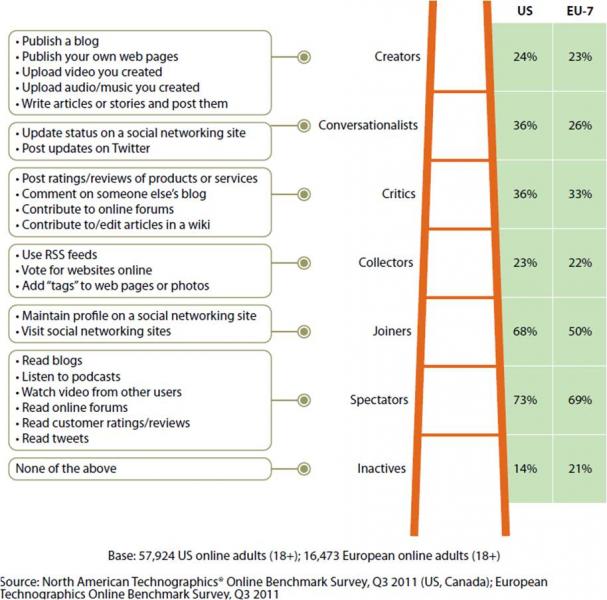
Currently 86% of online US adults and 79% of European online adults engage with social media. . Given the rise of blogging and social networks, Forrester researchers identified some unique traits about how social media users create, view, and interact with content online starting in 2006.

They went on to identify various characteristics of different groups by the names: Creators, Critics, Collectors, Joiners, Spectators, and Inactives. These are grouped in the above diagram as a ladder, with the highest level of engagement being at the top with the Creators.

From the book, Groundswell: Winning in a World Transformed by Social Technologies

  1. Creators sit at the top and at least once a month publish a blog or article online, maintain a Web page, or upload videos to YouTube, or upload audio/music, write articles or stories and post them. These are wired, techy people who feel the itch to create digital content to share with others. They use platforms like Blogger, WordPress, and Tumblr.
  2. Conversationalists, while not quite as engaged, update their status on a social networking site and post updates on Twitter. These are individuals who update Facebook, LinkedIn, or tweet.
  3. Critics post ratings/reviews of products or services, comment on someone else’s blog, contribute to online forums, and will add/edit articles in a wiki. These are the individuals we rely on so heavily when trying to ascertain whether a product or service is any good, in absence of a reliable word of mouth source. They’ll use Google Reviews, Yelp, TripAdvisor, or Foursquare.
  4. Collectors use RSS feeds, vote for websites online, add “tags” to web pages or photos. These individuals might curate content on Digg or StumbleUpon. They will tag friends on Facebook or Flickr. They use a service like Flipbook or Google Reader to consume site updates via RSS.
  5. Joiners maintain a profile on a social networking site and visit social networking sites. These are the casual participants that are on these networks and swing by from time to time.
  6. Spectators make up the bulk with roughly 3 out of 4 of online Americans and Europeans falling into this category. They read blogs, listen to podcasts, watch video from other users, read online forums, read customer ratings/reviews, and read tweets. They might check Facebook on a daily basis but they do not necessarily post content for others in their network to observe.
  7. Inactives have been shrinking since the study began. They do not participate in any of the above activities.

Rogers Adoption Curves and Social Media Users

The research shows that consumers are mostly Spectators online in the U.S. and Europe. The Early and Late Majority make up roughly 68% and this seems to map over to the social media user as well.

Much like we saw with Innovators and Early Adopters, not everyone can be first. While these typically make up around 16% of the curve, with Creators it seems to be continually climbing and currently sits at 24%. As the ease of publishing and creating digital content gets better and better, watch for Creators to grow. We would most likely get a better view if we asked about specific technology platforms. For example, how many are publishing on Pinterest or Tumblr?

Like we saw with Laggards, the same can be true of Inactives.

And just like the adoption curve, we can all bounce back and forth based on different needs we are trying to satisfy.

Next up, we’ll look at a handy tool for flushing out our user persona based on all this data.

Segmenting Customers for Digital Marketing

7-segment - 15

One of the biggest challenges when it comes to digital marketing is how to determine in what ways your audience will engage.

  • Will they follow us on Twitter?
  • Submit photos for our website?
  • Provide reviews on our brand experience?
  • Comment on our blog?

Much like we saw with how innovations move through the five different adopter categories that Dr. Everett Rogers outlined, the same can be said for how much people will interact with different content outlets online. Some will expect you to be on Twitter. Others will interact with you on Facebook. And still others will lurk in the shadows, observing and consuming, but not interacting in the light of the web (at least not with your brand).

A third way to segment customers for digital marketing

Traditionally marketing has looked at demographic and psychographic data as ways to identify and segment customers. “Female, upper-income, 25-34, African American, college-educated, who prefers high-end brands” was good enough for a long time. The thought being that by going narrower, the marketer gets a better return on their marketing dollars and does not pay to interrupt customers who would have no interest in buying.

But as we’ve seen, technology has forever broken this traditional model of marketing. The customer has a voice and the tools to assemble online. So, segmentation has become more difficult with the consumers ability to tune out all advertising and keep from being interrupted.

Today, a third way to group customer segments is coming to light – especially for digital marketing. Based on studies done by Forrester Research, this method goes by the term “Social Technographics”. By analyzing the online habits of U.S. adults, the company developed various categories to help the marketer predict what they might expect for engagement.

Note: These consumers are still sliced in part by demographic data. As you might expect, participation can vary widely by age and a bit by gender.

Let’s dive in and take a look at social media user segments.

Trust Online and Delightful Customer Experiences

The real benefit of delightful customer experiences

Let’s fast forward and assume the myriad of variables line up in our favor and we have a successful product launch for our Moleskine add-on:
  1. The product is gorgeous and has all the functional benefits we envisioned from our extensive prototyping and user testing.
  2. We are enjoying positive user reviews on Amazon
  3.  Great tweets and followers everyday
  4. Growing Facebook fans
  5. Steady search engine rankings
  6. Various blogs and websites reviewing the product positively

(Note: it rarely happen this way but for simplicity sake let’s say we bucked the odds on this one)

Ideal Digital Customer Engagement

In short, our product has not only delighted but surprised Chris at its usefulness.
  • He is ecstatic at how easy it is for him to pick up and go about his day without forgetting anything.
  • When he has a great idea, he can journal it out and make notes.
  • He’s revamped how he journals in his Moleskine based on tips he picked up off our blog.
  • He subscribes to our monthly email that highlights users tips and features an interview of people similar to Chris that are getting closer to their professional goals by being more productive and creative.
  • He retweets our content on Twitter.
  • He “Likes” us on Facebook and regularly chimes in on the comments for our posts and pictures.
  • Chris even approaches us for publishing some of his own tips on how he uses journaling professionally. We do an interview and feature him on the website under our “Friends We Love” section.

As smart online marketers, we are able to track Chris’s account on our website  (with his permission via his opt-in for future offers following his first purchase) and as a result can offer him special incentives through email marketing tools. He has numerous friends that use Moleskine journals as well and he starts to buy them the same product he is enjoying. We include a special note in Chris’s package and thank him for recommending us.

Chris is starting to become what marketers call an evangelist. He in effect is doing our marketing for us because he eagerly spreads the good word for us.

Key takeaway: Never underestimate the power of word of mouth, even in the digital age. We will always trust our friends and family’s remarks over any marketer’s message. In the absence of this, we will trust the crowd through user reviews and search results. You must do everything you can to ensure this happens in a positive light which is why every brand touchpoint must align.

Only through great word of mouth do brands grow and the marketing costs stay in check. The web has only amplified this and destroys or builds brand with frightening speed. Imagine how impossible this becomes when marketing a sub-par product or service.

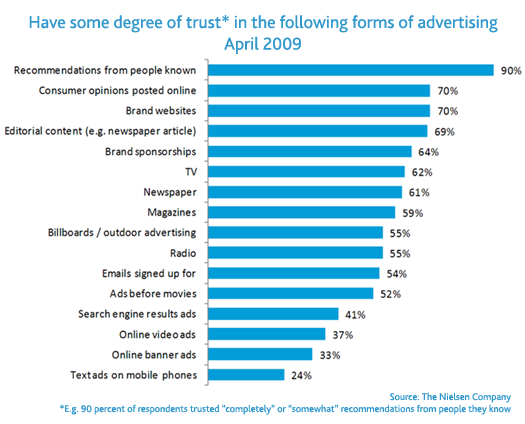
Finally, here’s some proof on the power of word of mouth from Nielsen.

  • 90% trust recommendations from people they know.
  • In absence of this, a whopping 70% trust consumer opinions online.

As the chart above shows, traditional advertising ranks way down the list for eliciting trust.

What About Mobile?

And finally, recent research from Pew Internet & American Life Project shows that during the 2010 holiday season:

More than half of adult cell phone owners used their cell phones while they were in a store during the 2011 holiday season to seek help with purchasing decisions. During a 30 day period before and after Christmas:

  • 38% of cell owners used their phone to call a friend while they were in a store for advice about a purchase they were considering making
  • 24% of cell owners used their phone to look up reviews of a product online while they were in a store
  • 25% of adult cell owners used their phones to look up the price of a product online while they were in a store, to see if they could get a better price somewhere else

Taken together, just over half (52%) of all adult cell owners used their phone for at least one of these three reasons over the holiday shopping season and one third (33%) used their phone specifically for online information while inside a physical store—either product reviews or pricing information.

We can’t win on price. We can’t advertise our way to becoming trusted brands. We can’t hope that customers won’t use the web at the time of purchase.

There is nowhere to hide if we do not build remarkable experiences and engagement into our digital brand.