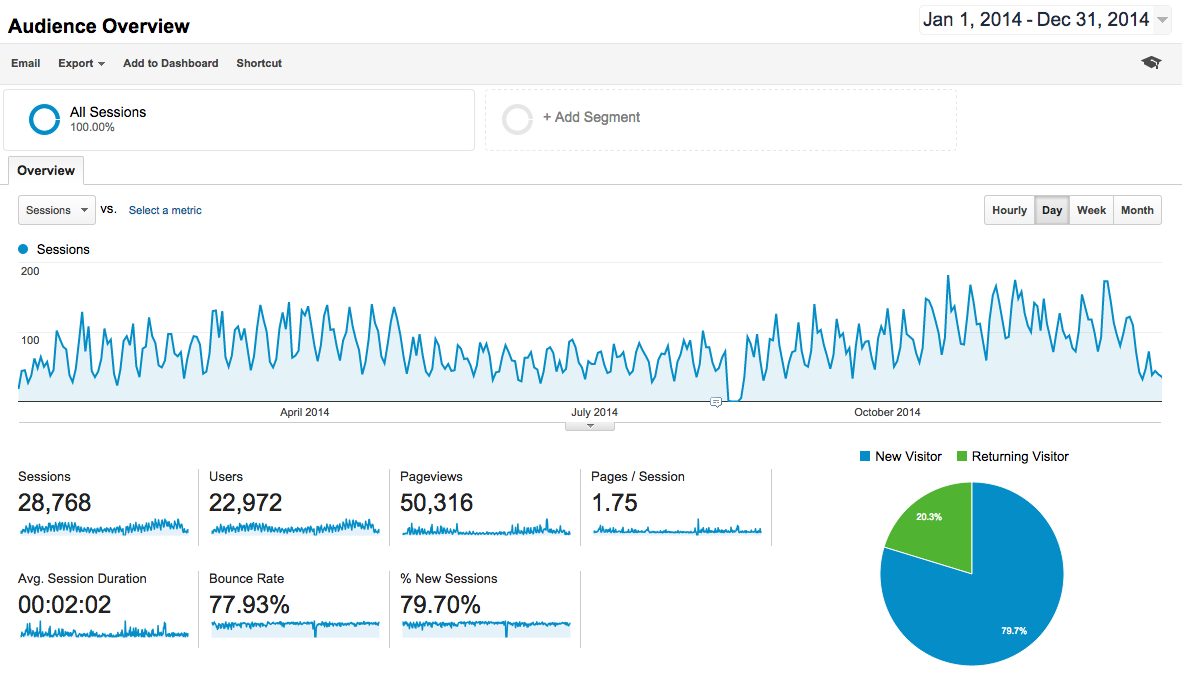
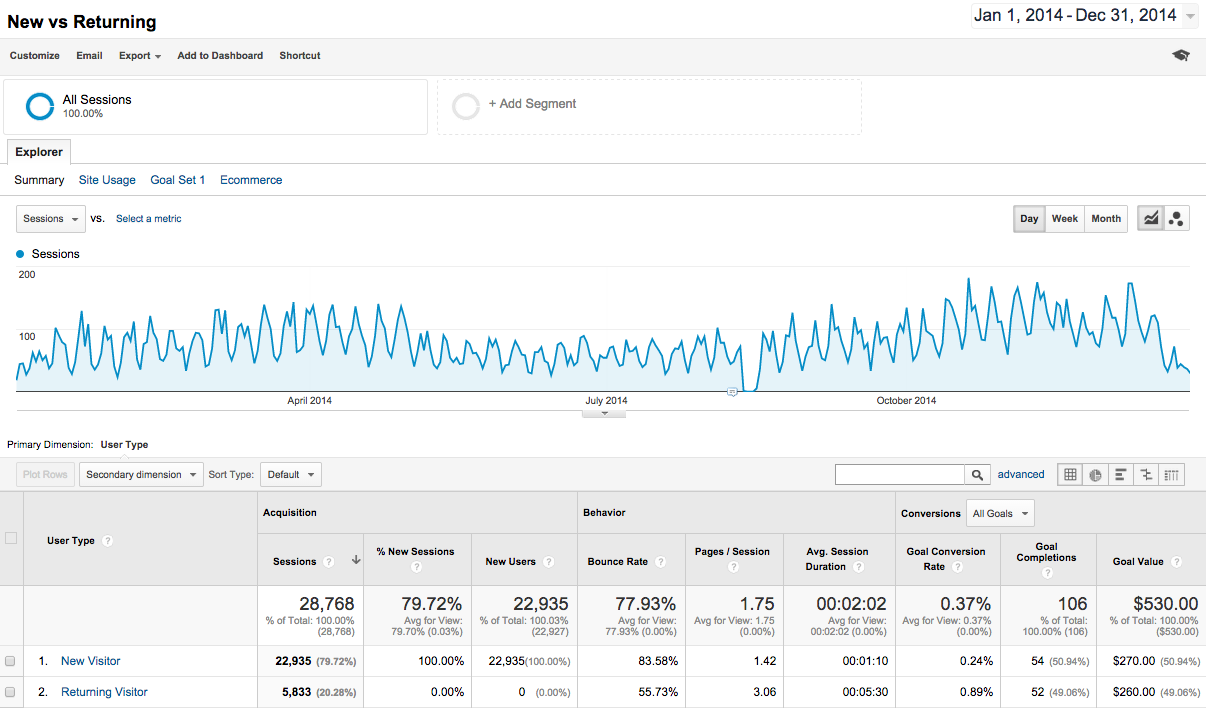
The first step in this journey of understanding basic analytics is to get a sense for important metrics and what they mean. There are numerous methods to apply and terms to know, with tremendous variation based around the business model and the digital property. We’re big fans of real-world examples so let’s take a peek of a website’s analytics from a fictitious company called BuyMoreSunglasses.
Before we dive in, we want to note that Google Analytics changes metric names and functionality fairly often. We do our best to update this text when these changes occur but if something seems unusual, it could be due to a change within GA itself.
BuyMoreSunglasses: Analytics Case Study
Note: The screenshot above is from an anonymous website showing a Google Analytics dashboard.
Let’s pretend that the dashboard above belongs to a fictitious website called BuyMoreSunglasses.com. We can see there are plenty of opportunities to improve the site’s performance and we’ll step through each of these metrics in the following sections. Keep in mind, that these metrics are from Google Analytics, which is the most popular analytics platform. The names for each of these metrics and their general application do not necessarily apply to other common softwares available.
For the beginner, we will start with a basic overview that focuses on six simple metrics that major web analytics platforms track. (We will explain these based on our phone booth analogy from the previous section on Web Page Analytics Explained.)
Let’s dive in:
- Sessions
Simply put, this tells you that someone came to your website and spent some time browsing – or (remember our phone booth analogy) they showed up in town and started making phone calls on different street corners. The tracking code also measures how long they spent on the site or put another way – how long they stayed in town. With Sessions, you can see if the population in town is growing but not necessarily what kind of people – that’s where Users comes in. - Users
This is a very powerful metric because it starts to tell you how many people came to your website rather than total sessions. It works when the JavaScript tracking tag phones home and the analytics tool then sets a unique cookie on the user’s browser. This anonymous identifier stays on the person’s browser even after they leave your site. (Hint: if a user comes back a second time, two sessions will have been recorded but only one user.)
Here is Avinash Kaushik’s definition of Users:…the count of all the persistent unique cookie IDs during a given time period.
This metric isn’t perfect. For example, if a user hits your site in the Google Chrome browser and then returns using Firefox (or any other browser) they will be recorded as two separate unique visitors. It’s pretty unlikely that mass amounts of users will switch browsers but it is worth noting that some duplication can and does occur. In the online world, “Users” is a pretty standard metric that gets thrown out for measuring engagement and assessing value of a digital property. In general, if your web property starts to bring in more than 1 million Users per month, you will be doing just fine financially.
Note: The most important difference between Sessions and Users, is that multiple sessions can be attributed to one user but not vice-versa. In plain English, sessions are visits to the site and users are the visitors themselves. This will become important later on.
- New Visitor
Ready for an easy one? New visitors are users that are visiting the site for the first time. Why the “Google gods” decided to call these new visitors rather than users, we can’t say. But we do know that this is a helpful metric as we begin to determine how many of our users are first-timers and how many are coming back for more. - Returning Visitor
In the same way you look at your phone and see multiple calls from the same person in your call history, your website can see multiple sessions and attribute them to the same user. If a user comes back to your website using the same browser, he/she is flagged as having been to the site before via a unique cookie and thus will commonly show up in the analytics tool as a Returning Visitor. This is a helpful metric for measuring how loyal your web audience is and whether they are choosing to engage in your online efforts. (Not unlike when those loyal to you call or text on a consistent basis).For example, you might see that 30% of your monthly traffic is Returning Visitors. This could come from people clicking over to you from social media feeds, email marketing campaigns, or even repeatedly visiting the site to dig in. This starts to hint at loyalty and that your brand is building a following online. - Avg. Session Duration
This metric is used to determine how much time our users (both new and returning visitors) are spending on our website.This is based around when a page is requested. The call is placed, the timer starts ticking, and when the user hangs up (requests another page) that start and end time is logged. Every time a page is requested it’s referred to as a “timestamp”. Remember that the only way analytics software can log this interaction is when it delivers a page back to the user. One issue with Avg. Session Duration occurs when the user is on the last page of their visit and then leaves for another site. There is no easy way for the analytics tool to measure how long this interaction takes place on the last page. It’s as if the user places a call and then the phone dangles off the hook. Since there is no formal hang-up, Google Analytics cannot measure the time on that page.
A simple case study:
Let’s look at a BuyMoreSunglasses example to illustrate the user journey and analytics behind it:
- Maria, a user getting ready for her vacation to Belize, googles “black sunglasses”…
- If we’re lucky, our site (BuyMoreSunglasses.com) pops up in the SERPS (search engine results pages) and Maria hits the homepage. When this happens, a call is placed from the street corner and the message relayed to the analytics account says, “start the timer”.
- Next, Maria finds “Sunglasses” in the main navigation and clicks the link. Google Analytics receives the message: “Oh, the user moved onto another page, so we will log the time spent on the homepage and continue measuring the entire session.”Now a 2nd call has been placed from a different street corner (the BuyMoreSunglasses.com/Sunglasses page) and is being measured until Maria clicks a different page. The same interaction is measured for each page, which is our Avg. Time on Page. This metric calculates how long Maria spent on the homepage before clicking to the Sunglasses page and how long she stayed on the Sunglasses page before viewing a different page. The Avg. Time on Page can widely vary across a website. For example, a long, educational blog post might have an Avg. Time on Page of 3 minutes and 30 seconds while a homepage might have an Avg. Time on Page of 1 minute and 15 seconds.
- Maria decides she wants to look at other options – she types “Amazon.com” into the browser and she’s gone. The analytics has no idea for how long she spent on the last page – in effect, the call was placed but the phone never got hung up. (If Maria just left the browser open on that page, almost all analytics packages would “time out” after 29 minutes, not unlike the annoying beeping sound that land lines give after a set amount of time with no one on the line.)
- To recap: We know what pages the user visited based on the calls from different street corners. However, we do not know how long they spent on that last page and as a result, how long the visitor session truly was.We realize that Avg. Time on Page and Avg. Session Duration are still helpful metrics but it’s key that we look at our KPI’s. If we see a low Avg. Session Duration (maybe less than a minute), we probably aren’t convincing our users to convert. In this case, if Maria only spends 20 seconds on the Sunglasses page, we’ve failed to convince her to buy, which is an indicator that she’s not seeing what she wants. If we see certain pages with ridiculously low Avg. Time on Page and we are looking to convert a user (opt-in for an email, request information, purchase a product) then we know we have some work to do.
What’s a “Good” Avg. Session Duration?
This can be depressing. We all tend to overestimate how great our own work is – the actual numbers can be sobering. Avg. Session Duration varies widely based on:
- Industry (and type of website)
- Source or where the visitor is coming from (social media referrals tend to be very low as people quickly bounce back to Facebook or Twitter)
- Device (mobile users tend to spend less time on site.)
- Visual variables like page design and copy.
- Finally, if a site is not designed with a focus on a user flow scenario or even a simple call to action on the footer of each page to gently nudge the visitor along, the Avg. Session Duration can be quite low.
Around two to five minutes is a common range across all referring traffic sources.


